Lesson

Title: Measures of variation- Population Standard deviation

Grade: 9-a Lesson: S2-L2

Explanation: Hello students, let us learn a new topic in statistics today with definitions, concepts, examples, and worksheets included.

Lesson:

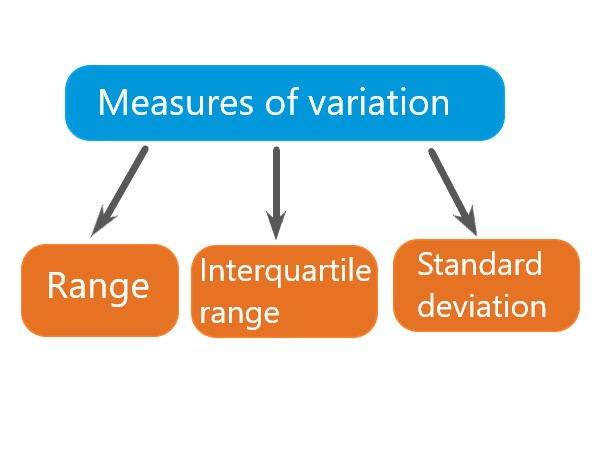
Definition: Measures of variation

  • Measures of variation summarize the spread of a data set.

  • They describe how measurements differ from each other and/or from their mean.

1

Explanation: The three most commonly used measures of variation are

  • Range

  • Interquartile range and

  • Standard deviation.

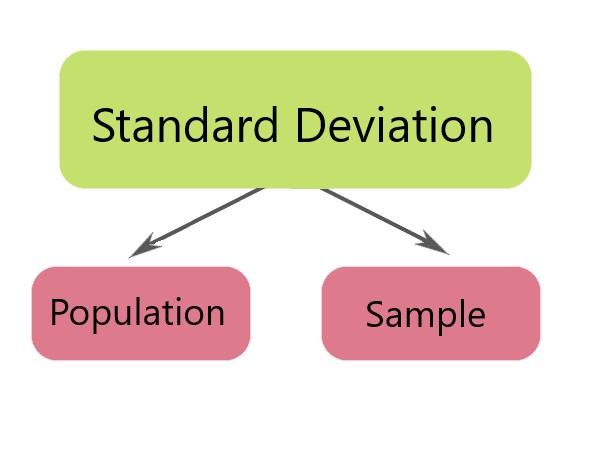
Definition: Standard deviation

  • Standard deviation can be referred to be the degree of dispersion.

  • It describes the way in which the values are spread across the data sample and also it is the measure of the variation of the data points from the mean.

  • It is numerically the positive square root of ‘Variance’.

2

Explanation: Different formulas are used for calculating standard deviations.

  • Depending on whether you have collected data from a whole population or a sample.

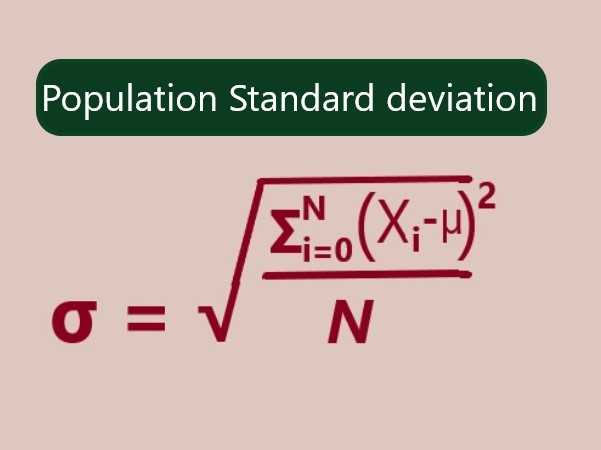
Definition: Population standard deviation

Population standard deviation is denoted by " \$\sigma\$ "

  • Where N = no. of observations,

  • \$X_i\$ = observations of data,

  • \$\mu\$ = mean of data (or) \$ \frac{ \sum_{i=0}^N X_i}{N} \$

3

Explanation: Steps for calculating Population standard deviation:

  • Find the mean.

  • Find the deviation from the mean (or) the difference of each number from the mean.

  • square each devation from the mean.

  • Find the sum of the squares.

  • Find the variance (or) divide with no.of observations(N) for population standard deviation and with no. of observations(n-1) for sample standard deviation.

  • Find the square root of the variance.

  • Standard deviation =\$\sqrt variance\$


Copyright © 2020-2022 saibook.us Contact: info@saibook.us Version: 1.5 Built: 13-March-2023 06:00 AM EST