Lesson Example Discussion Quiz: Class Homework |
Example |
Title: Mean for grouped data |
Grade: 9-a Lesson: S1-L4 |
Explanation: The best way to understand statistics is by looking at some examples. Take turns and read each example for easy understanding. |
Examples:
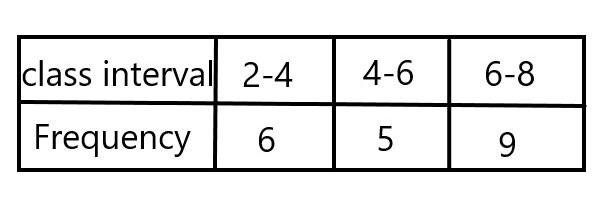
Find out the mean for the given observations
Step 1a
|
|
Mid-points of class-interval and add frequencies |
|
Explanation: Now take the midpoints of the class interval. i.e, \$(2+4)/2 = 3,(4+6)/2 = 5,(6+8)/2 = 7\$. Add all the frequencies i.e, \$6 + 5 + 9 = 20\$. |
|
Step 1b
|
|
Multiplying frequency with midpoints |
|
Explanation: Multiply the midpoint values with frequency i.e, \$3×6 = 18,5×5 = 25,7×9 = 63\$ Sum of midpoint values i.e, \$18+25+63 = 106\$ |
|
Step 1c
|
|
Mean = \$(\sumx_i f_i) / (\sumf_i)\$ |
|
Explanation: \$\sumx_i f_i = 106\$, \$\sumf_i = 20\$ Mean = \$106/20 = 5.3\$ |
|
Copyright © 2020-2022 saibook.us Contact: info@saibook.us Version: 1.5 Built: 13-March-2023 06:00 AM EST