Quiz At Home |
|
Title: Calculus, Statstics |
Grade: Core-SAT3 Lesson: Sfirst-F4 |
Explanation: Hello Students, time to practice and review. Let us take next 10-15 minutes to solve the ten problems using the Quiz Sheet. Then submit the quiz to get the score. This is a good exercise to check your understanding of the concepts. |
Quiz: at Home
| Problem Id | Problem | Options |
|---|---|---|
1 |
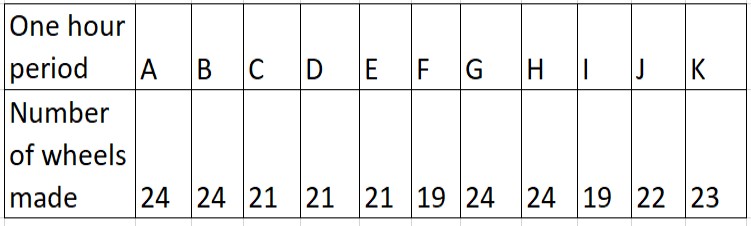
A study was conducted on the production rates of a company that produces tractor wheels. The table below shows the number of wheels made during 11 consecutive one-hour production periods.
What is the range of the number of wheels made for the 11 one-hour periods? |
A) 5.5 B) 5 C) 4 D) 4.5 |
2 |
In a scatterplot showing the relationship between the number of days absent from school (x) and test scores (y), there is one point far away from the others. What is this point called, and what effect can it have on the data analysis? |
A) Anomaly; It can distort the line of best fit, influence correlation, impact statistical measures, and potentially lead to misinterpretation of the data. B) Extrapolation point; It can affect the accuracy of predictions made based on the scatterplot. C) Outlier; It can skew the analysis, potentially leading to incorrect conclusions about the relationship between days absent and test scores. D) Deviation; It can introduce variability into the data analysis, affecting the reliability of conclusions drawn from the scatterplot. |
3 |
In a certain community, 60% of the people are women and 40% are men. Of the women, 50% have brown hair, while 70% of the men have brown hair. If a randomly chosen person has brown hair, what is the probability that this person is a woman? |
A) 0.51 B) 0.58 C) 0.62 D) 0.68 |
4 |
A school claims that 70% of its students participate in extracurricular activities. A random sample of 150 students found that 90 participated. Test the school’s claim at the 0.05 significance level. |
A) ± 5.89 B) ± 2.36 C) ± 1.96 D) ± 4.56 |
5 |
A lottery ticket costs $2. The prize structure is as follows: 1 in 1,000,000 chance to win $1,000,000. 1 in 10,000 chance to win $5,000. 1 in 1,000 chance to win $100. 1 in 100 chance to win $10. What is the expected value of buying a single lottery ticket? |
A) $2.81 B) $1.46 C) $2.09 D) $1.70 |
6 |
In a class, student ages are 18, 19, 20, 21, 22, x, and 24. With a mean of 21 and a mean absolute deviation of 1.714, determine the value of 'x' and the sum of 'x' and the lower value. |
A) 44 B) 38 C) 33 D) 41 |
7 |
In a study of the heights of students in a school, the following data was recorded (in inches): 62, 66, 63, 68, 69, 71, 65, 63, 73, 70, 63, 69, 70, 68, 63, 69, 71, 76, 63, and 68. Provide a statistical analysis of the height distribution in the form of a box-and-whisker plot. |
A) Minimum Height: 62 inches B) Minimum Height: 62 inches C) Minimum Height: 62 inches D) Minimum Height: 62 inches |
8 |
Consider the following dataset representing the number of daily calories consumed by a group of individuals over a week: 1800, 1900, 2000, 2100, 2200, 2300, 2400, 2500, 2600, 2700, 2800, 2900, 3000, 3100, 3200, and 5000. Determine if there are any outliers in the dataset using the 1.5 \times IQR rule. Create a box plot to visualize the data and identify any outliers. |
A) 4000 Calories B) 2000 Calories C) 5000 Calories D) 0 Calories |
9 |
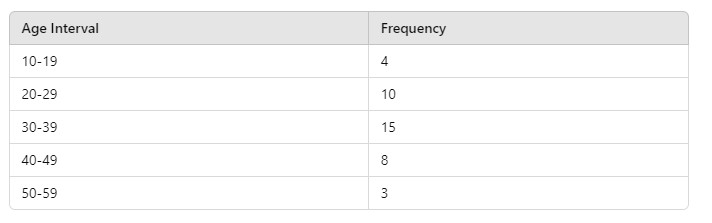
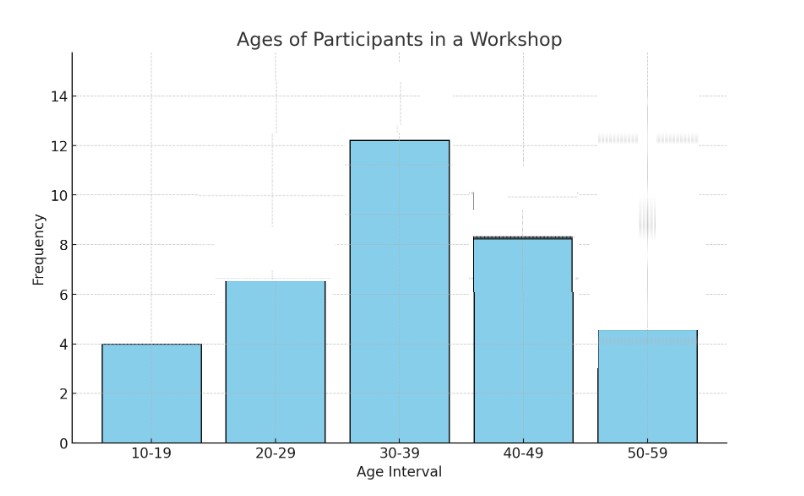
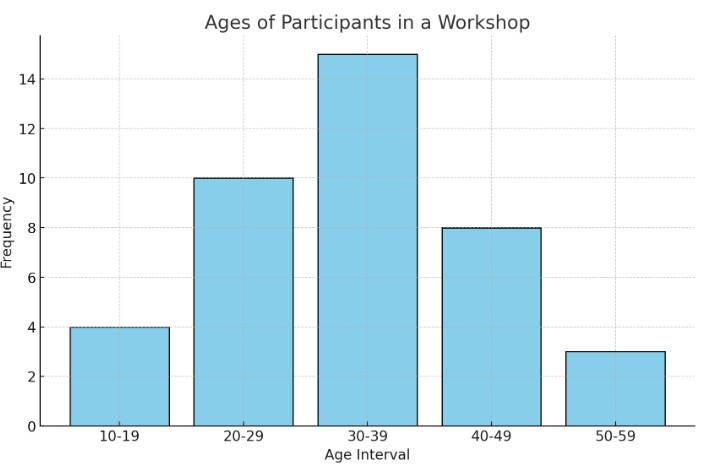
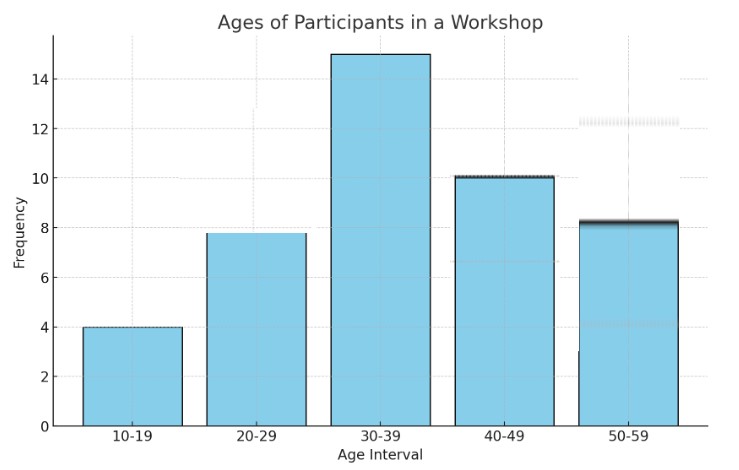
The ages of participants in a workshop are grouped into intervals and presented in a histogram. The data is as follows:
Construct a histogram based on the given data. |
A) B) C) D) None of the above |
10 |
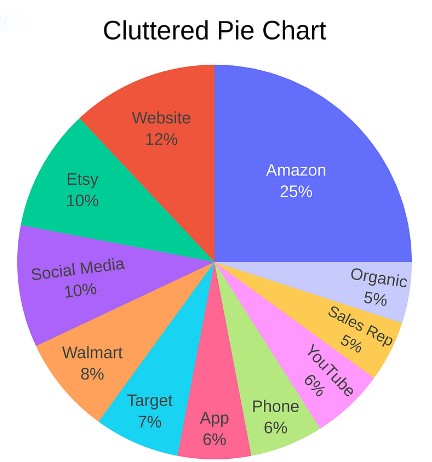
Which source has the smallest contribution, and what is its percentage?
|
A) Phone and App, both with 6%. B) App and YouTube, both with 5%. C) Organic and Phone, both with 5%. D) Organic and Sales Rep, both with 5%. |
Copyright © 2020-2022 saibook.us Contact: info@saibook.us Version: 1.5 Built: 08-July-2024 09:20AM EST