Lesson Example Discussion Quiz: Class Homework |
Quiz At Home |
Title: Statistics |
Grade: Best-SAT3 Lesson: S8-P1 |
Explanation: Hello Students, time to practice and review. Let us take next 10-15 minutes to solve the ten problems using the Quiz Sheet. Then submit the quiz to get the score. This is a good exercise to check your understanding of the concepts. |
Quiz: at Home
| Problem Id | Problem | Options |
|---|---|---|
1 |
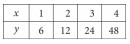
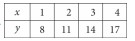
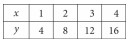
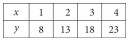
In which of the following tables is the relationship between the values of x and their corresponding y-values nonlinear? |
A) B) C) D) |
2 |
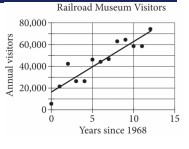
The scatterplot above shows the number of visitors to a railroad museum in Pennsylvania each year from 1968 to 1980, where t is the number of years since 1968 and n is the number of visitors. A line of best fit is also shown. Which of the following could be an equation of the line of best fit shown?
|
A) n = 4690 + 16090t B) n = 16090 + 4680t C) n = 16090 + 9060t D) n = 9060 + 16060t |
3 |
In a class, 60% of students like math, 40% like science, and 20% like both math and science. If a student is chosen at random, what is the probability that the student likes either math or science? |
A) 1.36 B) 1.2 C) 0.8 D) 2.35 |
4 |
A study was done on the weights of different types of fish in a pond. A random sample of fish was caught and marked in order to ensure that none were weighed more than once. The sample contained 250 largemouth bass, of which 40% weighed more than 3 pounds. Which of the following conclusions is best supported by the sample data? |
A) Approximately 40% of the largemouth bass in the pond weigh more than 3 pounds. B) Approximately 40% of all fish in the pond weigh more than 2 pounds. C) The average weight of all fish in the pond is approximately 3 pounds. D) The majority of all fish in the pond weigh less than 3 pounds. |
5 |
Let’s make it more challenging by considering a scenario where the daily registration rate changes over time.Let’s say the daily registration rate follows a pattern where it starts at 1,200 on the first day and increases by 100 each subsequent day. To find out how many accounts are registered in the first 5 days, we need to sum up the registrations for each day. This involves finding the sum of an arithmetic sequence. |
A) 7100 B) 7000 C)6900 D) 7200 |
6 |
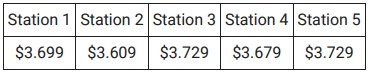
In the table above, Melissa recorded the price of one gallon of regular gas from five different local gas stations on the same day. What is the median of the gas prices Melissa recorded?
|
A) $3.70 B) $3.73 C) $3.68 D) $3.69 |
7 |
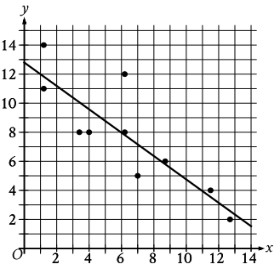
The scatterplot shows the relationship between two variables x, and y. A line of best fit is also shown. Which of the following is closest to the slope of the line of best fit shown?
|
A) - 0.8 B) - 2.4 C) 2.4 D) 0.8 |
8 |
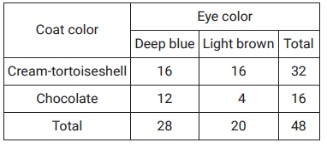
The data on the coat color and eye color of 48 Himalayan kittens available for adoption were collected and summarized in the table above. What fraction of the chocolate-colored kittens have deep blue eyes?
|
A) \$12/48\$ B) \$12/28\$ C) \$12/16\$ D) \$16/32\$ |
9 |
A study estimates that 60% of a certain population supports a particular policy, with a margin of error of 3%. If p represents the true proportion of the population that supports the policy, what range of values is most plausible for p? |
A) \$57% < p\$ B) \$57% < p < 63%\$ C) \$p < 63%\$ D) \$p < 57%\$ |
10 |
A sample of 40 fourth-grade students was selected at random from a certain school. The 40 students completed a survey about the morning announcements, and 32 thought the announcements were helpful. Which of the following is the largest population to which the results of the survey can be applied? |
A) All fourth-grade students in the county in which the school is located. B) All students at the school. C) The 40 students who were surveyed. D) All fourth-grade students at the school. |
Copyright © 2020-2022 saibook.us Contact: info@saibook.us Version: 1.5 Built: 09-October-2024 09:20AM EST