Lesson Example Discussion Quiz: Class Homework |
Quiz At Home |
Title: Statistics |
Grade: Top-SAT3 Lesson: S8-P2 |
Explanation: Hello Students, time to practice and review. Let us take next 10-15 minutes to solve the ten problems using the Quiz Sheet. Then submit the quiz to get the score. This is a good exercise to check your understanding of the concepts. |
Quiz: at Home
| Problem Id | Problem | Options |
|---|---|---|
1 |
A company’s revenue increased from $500,000 last year to $600,000 this year. Calculate the percentage increase in revenue. |
A) 30% B) 20% C) 25% D) 15% |
2 |
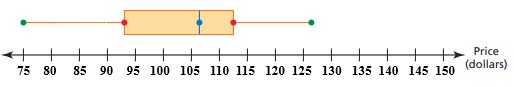
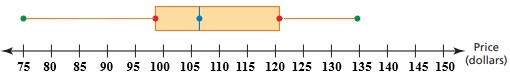
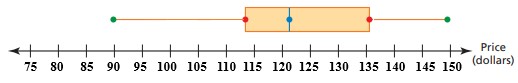
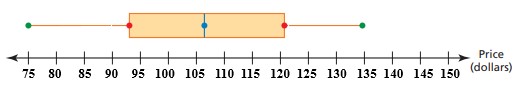
The following are the scores obtained by 20 students in a mathematics test 75, 108, 82, 130, 88, 125, 90, 112, 92, 95, 135, 98, 100, 102, 128, 105, 122, 110, 115, and 120. Create a box and whisker plot to represent the distribution of scores. |
A) B) C) D) |
3 |
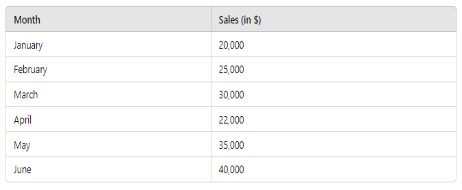
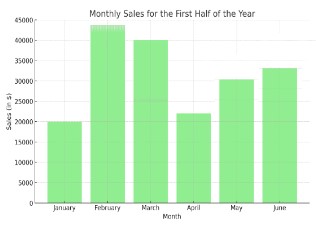
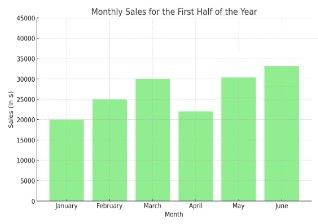
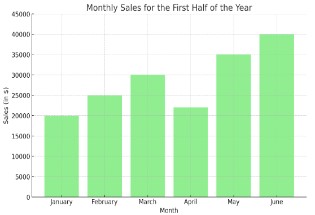
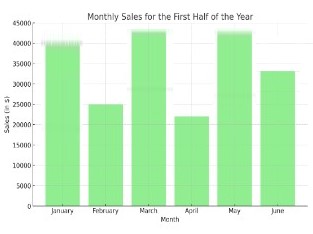
A company has recorded its monthly sales for the first half of the year. The data is as follows:
|
A) B) C) D) |
4 |
The test scores of 20 students are as follows: 50, 55, 60, 65, 70, 75, 80, 85, 90, 95, 60, 65, 70, 75, 80, 85, 90, 95, 50, and 55. Construct a histogram to represent the student’s distribution. |
A) Uniform B) Skewed C) Symmetric D) Unsymmetric |
5 |
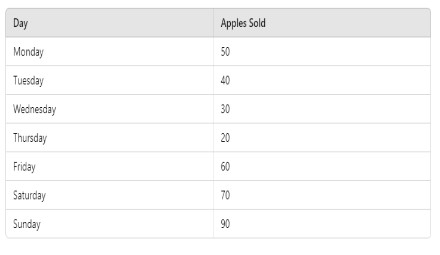
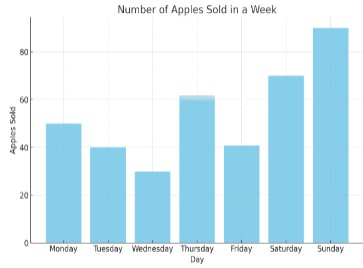
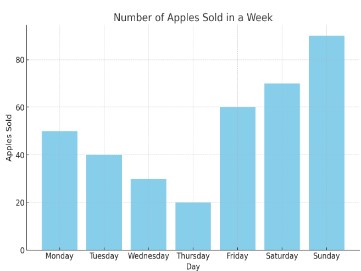
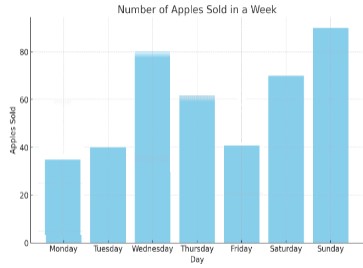
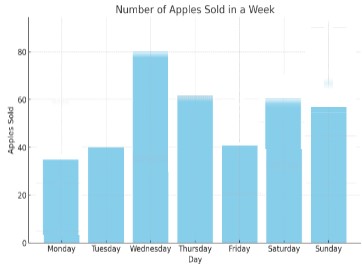
Given the data below, create a bar graph that represents the number of apples sold in a week. Draw a bar graph representing the data.
|
A) B) C) D) |
6 |
Calculate the mean absolute deviation (MAD) for the heights (in centimeters) of a group of students: 160, 165, 170, 175, 180, and 185. |
A) 6.9 B) 7.9 C) 7.5 D) 8.1 |
7 |
You have the following dataset representing the scores of students in a math test: 55, 57, 60, 61, 65, 67, 68, 70, 70, 72, 73, 75, 75, 78, 80, 82, 84, 85, 88, 90, 92, 95, 98, and 100. Identify the outliers in the dataset using the Interquartile Range (IQR) method. |
A) 47.56, 112.75 B) 49.23, 114.23 C) 45.23, 113.69 D) 42.75, 112.75 |
8 |
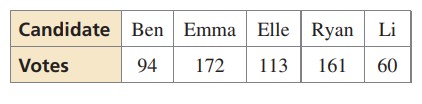
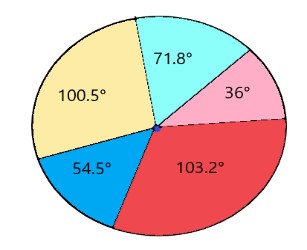
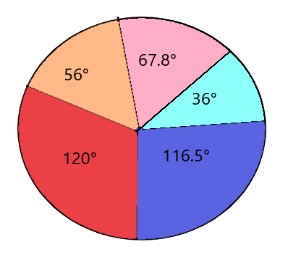
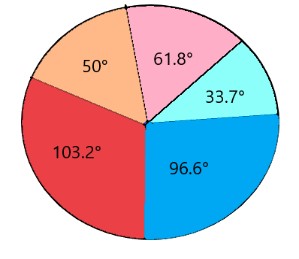
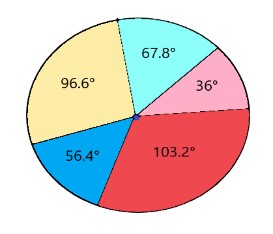
Display the data in a circle graph.
|
A) B) C) D) |
9 |
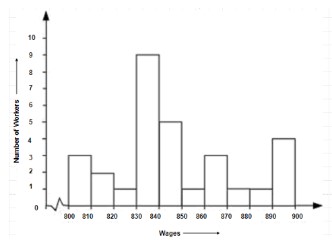
Which group has the maximum number of workers?
|
A) 820 - 830 B) 800 - 810 C) 830 – 840 D) 890 - 900 |
10 |
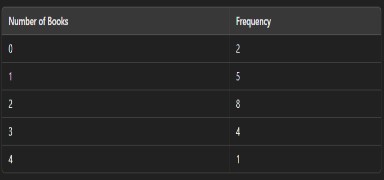
What is the mode of the number of books read?
|
A) 2 B) 7 C) 10 D) 5 |
Copyright © 2020-2022 saibook.us Contact: info@saibook.us Version: 1.5 Built: 17-July-2024 09:20AM EST