Lesson Example Discussion Quiz: Class Homework |
Step-4 |
Title: Venn Diagrams, Circle graphs, Bar and Line Graphs |
Grade: 1400-a Lesson: S4-L7 |
Explanation: Hello Students, time to practice and review the steps for the problem. |
Lesson Steps
| Step | Type | Explanation | Answer |
|---|---|---|---|
1 |
Problem |
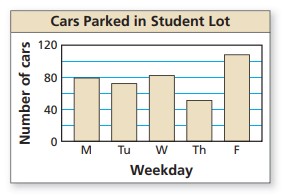
Use the bar graph to answer each question. On which day of the week was the greatest number of cars parked in the student lot?
|
|
2 |
Step |
Based on the bar graph, The bar for Friday is the tallest, indicating the highest number of cars parked on that day. |
|
3 |
Step |
Therefore, Friday has the greatest number of cars parked in the student lot. |
|
4 |
Choice.A |
The bar graph shows that the number of cars parked in the student lot is highest on Friday compared to any other day of the week. This is indicated by the tallest bar on the graph being associated with Friday |
Friday |
5 |
Choice.B |
The bar representing Monday is not the tallest. While there may be a significant number of cars parked on Monday, it does not surpass the number on Friday |
Monday |
6 |
Choice.C |
The bar representing Sunday is not the tallest. The number of cars parked on Sunday is less than the number of cars parked on Friday |
Sunday |
7 |
Choice.D |
The bar representing Tuesday is also not the tallest. Although cars may be parked in significant numbers on Tuesday, it does not exceed the count for Friday |
Tuesday |
8 |
Answer |
Option |
A |
9 |
Sumup |
Can you summarize what you’ve understood in the above steps? |
|
Copyright © 2020-2022 saibook.us Contact: info@saibook.us Version: 1.5 Built: 18-June-2024 09:20AM EST