Lesson Example Discussion Quiz: Class Homework |
Quiz At Home |
Title: Venn Diagrams, Circle graphs, Bar and Line Graphs |
Grade: 1400-a Lesson: S4-L7 |
Explanation: Hello Students, time to practice and review. Let us take next 10-15 minutes to solve the ten problems using the Quiz Sheet. Then submit the quiz to get the score. This is a good exercise to check your understanding of the concepts. |
Quiz: at Home
| Problem Id | Problem | Options |
|---|---|---|
1 |
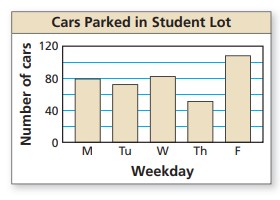
Use the bar graph to answer each question. How many cars were parked in the student lot on Monday?
|
A) 80 cars B) 75 cars C) 83 cars D) 78 cars |
2 |
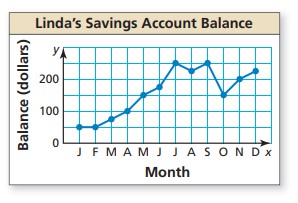
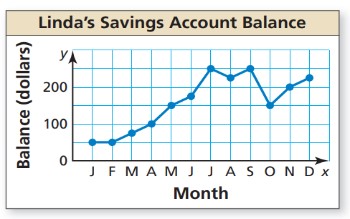
Use the line graph to answer each question. Between which two consecutive months did Linda’s account balance increase the most?
|
A) January and May B) June and July C) October and December D) May and June |
3 |
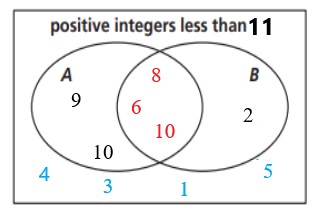
Use the Venn diagrams you drew in Exercises 1 – 3 to decide whether the statement is true or false. Explain your reasoning. All positive odd numbers less than 11 are prime. |
A) Both B) TRUE C) FALSE D) None of this |
4 |
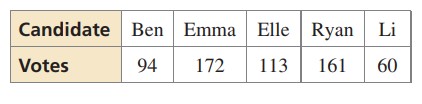
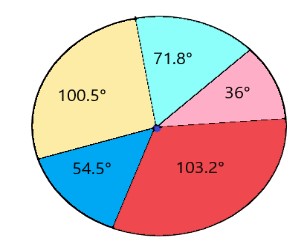
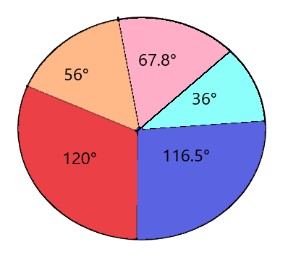
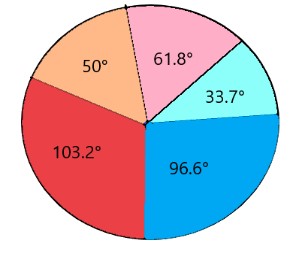
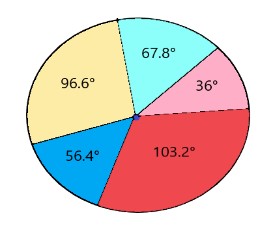
Display the data in a circle graph.
|
A) B) C) D) |
5 |
Use the line graph to answer each question. How much less was Linda’s account balance in October than in July?
|
A) 90 B) 50 C) 110 D) 100 |
6 |
The bar graph below shows the monthly sales (in thousands of dollars) of a company, and the line graph shows the monthly profits (in thousands of dollars) over the same period. Graph Data:
January: Sales = $50k, Profits = $10k In which month did the company have the highest sales profits? |
A) April B) May C) June D) January |
7 |
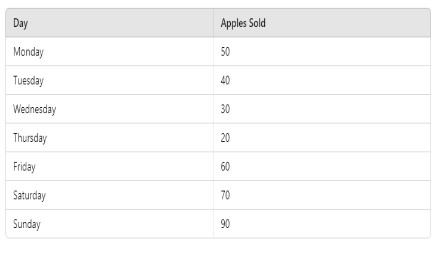
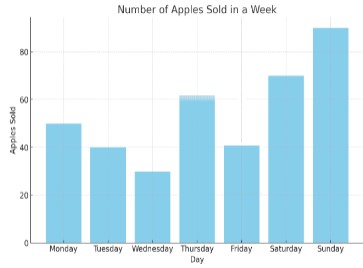
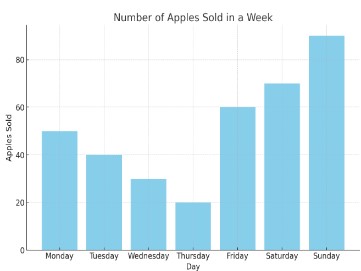
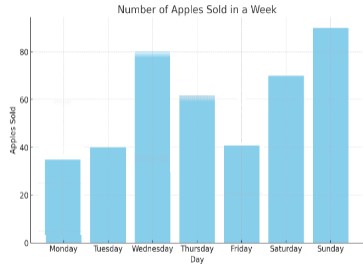
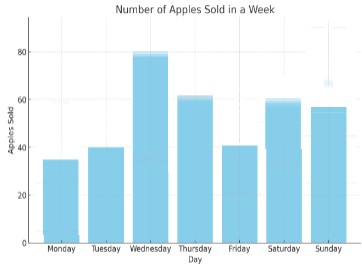
Given the data below, create a bar graph that represents the number of apples sold in a week. Draw a bar graph representing the data.
|
A) B) C) D) |
8 |
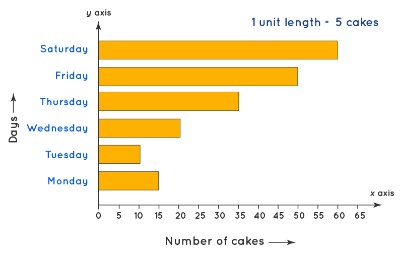
Observe the given horizontal bar graph which shows the baking of cakes in a bakery from Monday to Saturday. Find out the day on which the minimum number of cakes were baked.
|
A) Monday B) Sunday C) Friday D) Tuesday |
9 |
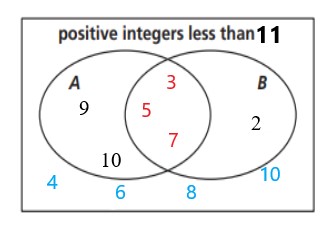
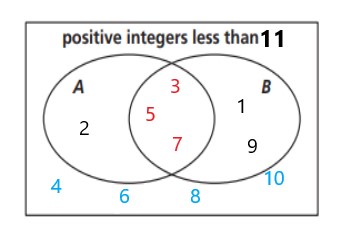
Draw a Venn diagram of the sets described. Of the positive integers less than 11, set A consists of prime numbers, and set B consists of odd numbers. |
A) B) C) D) None of this |
10 |
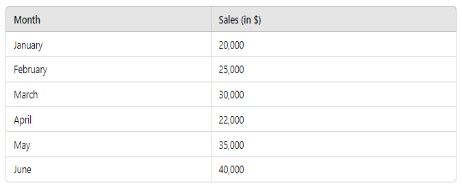
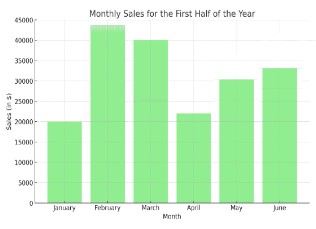
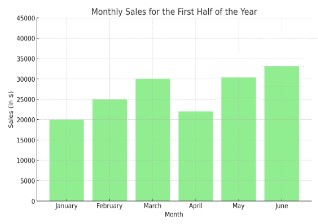
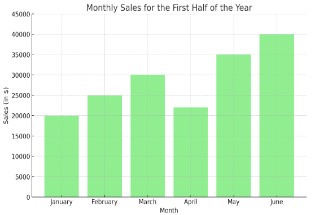
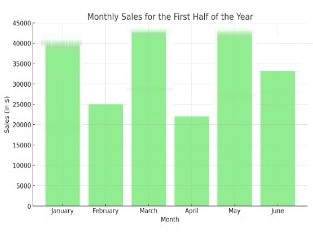
A company has recorded its monthly sales for the first half of the year. The data is as follows: Draw a bar graph representing the data.
|
A) B) C) D) |
Copyright © 2020-2022 saibook.us Contact: info@saibook.us Version: 1.5 Built: 18-June-2024 09:20AM EST