Lesson Example Discussion Quiz: Class Homework |
Step-3 |
Title: Venn Diagrams, Circle graphs, Bar and Line Graphs |
Grade: 1400-a Lesson: S4-L7 |
Explanation: Hello Students, time to practice and review the steps for the problem. |
Lesson Steps
| Step | Type | Explanation | Answer |
|---|---|---|---|
1 |
Problem |
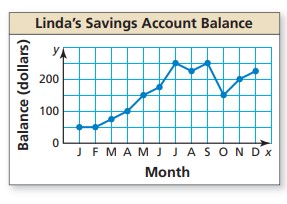
Use the line graph to answer each question. In which month(s) was Linda’s account balance $150?
|
|
2 |
Step |
Based on the line graph. |
|
3 |
Step |
Therefore, Linda’s account balance was $150 are May and October. |
|
4 |
Choice.A |
This option suggests that Linda’s account balance reached $150 in both January and May. You would look at the line graph and check if the line crosses the $150 mark on the y-axis during these two months |
January and May |
5 |
Choice.B |
This option indicates that the account balance was $150 in June and July. To confirm, you would see if the graph shows the balance intersecting $150 for both of these months |
June and July |
6 |
Choice.C |
According to this option, Linda’s balance was $150 in October and December. You can verify this by finding where the line hits $150 in these months on the graph |
October and December |
7 |
Choice.D |
This option states that the balance was $150 in May and October. You would check if the graph shows the balance crossing the $150 mark in these two specific months |
May and October |
8 |
Answer |
Option |
D |
9 |
Sumup |
Can you summarize what you’ve understood in the above steps? |
|
Copyright © 2020-2022 saibook.us Contact: info@saibook.us Version: 1.5 Built: 18-June-2024 09:20AM EST