Quiz In Class |
|
Title: Statistics |
Grade: 1300-a Lesson: T1-P1 |
Explanation: Hello Students, time to practice and review. Let us take next 10-15 minutes to solve the ten problems using the Quiz Sheet. Then submit the quiz to get the score. This is a good exercise to check your understanding of the concepts. |
Quiz: in Class
| Problem Id | Problem | Options |
|---|---|---|
1 |
Data set A consists of the heights of 75 objects and has a mean of 25 meters. |
A) 41 B) 45 C) 43 D) 47 |
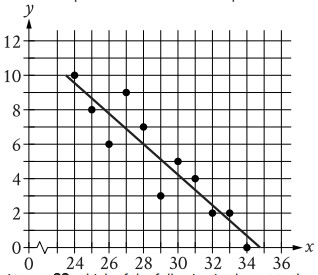
2 |
The scatterplot shows the relationship between two variables, x and y. A line of best fit for the data is also shown.
|
A) 0.4 B) 2.4 C) 1.5 D) 3.3 |
3 |
In a class, students are randomly assigned to one of three projects: Project A, Project B, or Project C. If 40% of the students are assigned to Project A and 25% are assigned to Project B, what percentage of students are assigned to Project C? |
A) 42% B) 31% C) 35% D) 39% |
4 |
A survey was conducted to estimate the proportion of adults in a city who support a proposed policy change. The survey found that 60% of the 500 surveyed adults support the policy change, with a margin of error of 4%. |
A) r < 56% B) 56% > r C) r < 64% D) 56% < r < 64% |
5 |
Data set F consists of 55 integers between 170 and 290. Data set G consists of all the integers in data set F as well as the integer 10. Which of the following must be less for data set F than for data set G? |
A) I only B) II only C) I and II D) Neither I nor II |
6 |
For which of the following data sets is the mean greater than the median? |
A) 5, 5, 5, 5, 5, 5, 5, 5, and 5. B) 7, 107, 107, 207, 207, 207, 307, 307, and 307. C) 2, 4, 8, 16, 32, 64, 128, 256, and 512. D) 0, 10, 20, 30, 40, 50, 60, 70, and 80. |
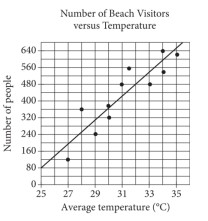
7 |
The scatterplot above shows the size x and the sale price y of 25 houses for sale in Town H. Which of the following could be an equation for a line of best fit for the data?
|
A) y = 200x + 100 B) y = 100x + 100 C) y = 100x D) y = 50x + 100 |
8 |
A box contains 13 red pens and 37 blue pens. If one of these pens is selected at random, what is the probability of selecting a red pen? (Express your answer as a decimal or fraction, not as a percent.) |
A) \$13/50\$ B) \$13/59\$ C) \$14/45\$ D) \$15/89\$ |
9 |
In a survey conducted among 200 customers at a grocery store, 40 customers indicated that they prefer organic produce. The store has a total customer base of 10,000 people. Using this information, estimate how many customers in total would prefer organic produce. |
A) 2,100 B) 2,000 C) 1,800 D) 1,900 |
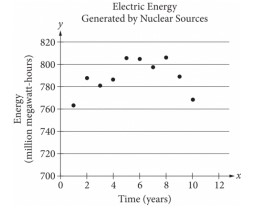
10 |
The scatterplot below shows the amount of electric energy generated, in millions of megawatt-hours, by nuclear sources over a 10 ‑ year period. Of the following equations, which best models the data in the scatterplot?
|
A) \$"y" = 1.674 "x"^2 + 19.76 - 745.73\$ B) \$"y" = - 1.674 "x"^2 - 19.76 - 745.73\$ C) \$"y" = - 1.674 "x"^2 + 19.76 + 745.73\$ D) \$"y" = 1.674 "x"^2 + 19.76 + 745.73\$ |
Copyright © 2020-2022 saibook.us Contact: info@saibook.us Version: 1.5 Built: 05-June-2024 09:20AM EST