Quiz In Class |
|
Title: Statistics |
Grade: 10-a Lesson: T1-P1 |
Explanation: Hello Students, time to practice and review. Let us take next 10-15 minutes to solve the ten problems using the Quiz Sheet. Then submit the quiz to get the score. This is a good exercise to check your understanding of the concepts. |
Quiz: in Class
| Problem Id | Problem | Options |
|---|---|---|
1 |
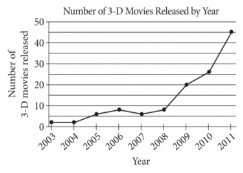
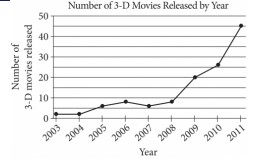
The line graph above shows the number of 3-D movies released each year from 2003 to 2011. Calculate the total number of 3-D movies released from 2003 to 2011.
|
A) 125 B) 105 C) 110 D) 101 |
2 |
According to the line graph above, between which two consecutive years was there the greatest change in the number of 3‑D movies released?
|
A) 2009 – 2010 B) 2010 – 2011 C) 2003 – 2004 D) 2008 – 2009 |
3 |
A total of 25 men registered for singing lessons. The frequency table shows how many of these singers have certain voice types. If one of these singers is selected at random, what is the probability he is a baritone? |
A) 0.6 B) 0.4 C) 0.1 D) 0.67 |
4 |
A survey finds that 45 out of 200 people prefer a new brand of coffee. Construct a 95% confidence interval for the proportion of people who prefer the new brand. |
A) Between 17.25% and 25.36% B) Between 16.72% and 28.29% C) Between 16.72% and 28.28% D) Between 15.23% and 28.28% |
5 |
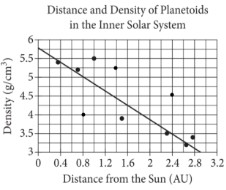
The scatter plot above shows the distance and density of planetoids in the inner solar system, with a trend line indicating the general relationship between these two variables. Derive the equation of the trend line (linear regression line) shown in the scatter plot.
|
A) y = − 0.833x + 5.733 B) y = − 0.853x + 5.738 C) y = 0.833x - 5.733 D) y = 2.833x + 5.738 |
6 |
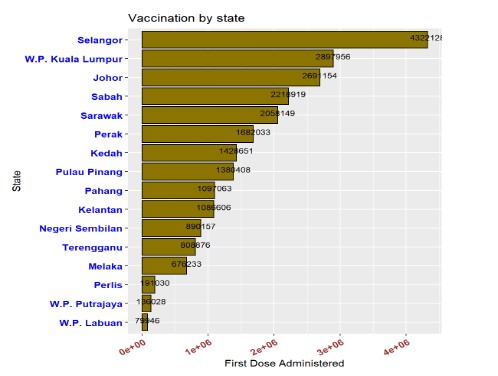
Determine the states that have administered first doses above and below the median number of doses. How many states fall into each category?
|
A) 18 states B) 20 states C) 16 states D) 15 states |
7 |
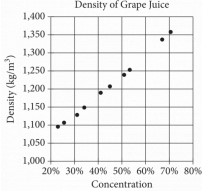
The densities of different concentrations of grape juice are shown in the scatterplot above. According to the trend shown by the data, which of the following is closest to the predicted density, in kilograms per cubic meter \$("kg"/"m")\$, for grape juice with a concentration of 60%?
|
A) 1,300 B) 1,350 C) 1,250 D) 1,200 |
8 |
You have a standard deck of 52 playing cards. What is the probability of drawing an Ace from the deck? |
A) \$4/13\$ B) \$2/13\$ C) \$3/13\$ D) \$41/13\$ |
9 |
A researcher claims that the average height of a certain plant species is 150 cm. A sample of 20 plants has an average height of 145 cm with a standard deviation of 10 cm. Test the researcher’s claim at the 0.05 significance level. |
A) 152 cm B) 150 cm C) 154 cm D) 156 cm |
10 |
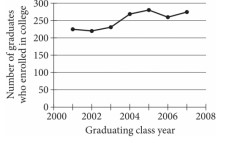
The line graph shows the number of graduates from the classes of 2001 through 2007 at a certain school who enrolled in college within 24 months of graduation. Of the following, which class had the fewest graduates who enrolled in college within 24 months of graduation?
|
A) 2004 B) 2005 C) 2002 D) 2007 |
Copyright © 2020-2022 saibook.us Contact: info@saibook.us Version: 1.5 Built: 10-June-2024 09:20AM EST