Lesson Topics Discussion Quiz: Class Homework |
Steps-1 |
Title: Probability |
Grade Lesson s6-l3 |
Explanation: Hello Students, time to practice and review the steps for the problem. |
Quiz: Discussion Step
| Id | Type | Name | Note |
|---|---|---|---|
1 |
Problem |
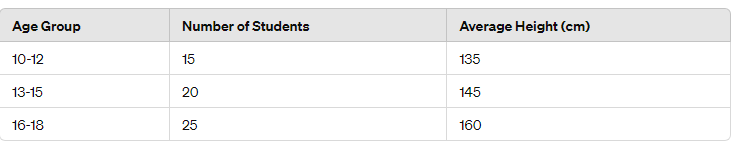
Suppose you have a dataset of students' ages and their corresponding heights. The table below shows the number of students in different age groups and their average heights: Calculate the weighted average height of the students in this dataset.
|
|
2 |
Step |
The weighted average height takes into account the number of students in each age group. To calculate it, we multiply the average height of each age group by the number of students in that group, sum those products, and then divide by the total number of students. |
|
3 |
Step |
From the table you provided, we can calculate the weighted average height as follows: |
|
4 |
Step |
Multiply the average height of each age group by the number of students in that group: |
→ \$(135 cm \times 15 "students") = 2025 cm\$ → \$(145 cm \times 20 "students") = 2900 cm\$ → \$(160 cm \times 25 "students") = 4000 cm\$ |
5 |
Step |
Sum the products |
2025 cm + 2900 cm + 4000 cm = 8925 cm |
6 |
Step |
The total number of students |
15 students + 20 students + 25 students = 60 students |
7 |
Step |
\$"Weighted average height" = "Sum of weighted terms" / "Total number of terms"\$ |
|
8 |
Step |
The weighted average height is |
\$(8925 cm )/ (60 "students")\$ = 148.75 cm |
9 |
Solution |
Therefore, the weighted average height of the students in this dataset is approximately 148.75 cm. |
|
10 |
Sumup |
Please summarize steps |
|
Choices |
|||
11 |
Choice-A |
This is the correct answer. It considers the number of students in each age group (weighting) when calculating the average height |
Correct 148.75cm |
12 |
Choice-B |
This option is significantly lower than what we’d expect for the weighted average height. The average heights in the table (135cm, 145cm, 160cm) are already baseline averages for each age group. The weighted average considers the number of students, and because there are likely to be more students with heights closer to the initial averages, the overall weighted average wouldn’t be this low |
Wrong 123.50cm |
13 |
Choice-C |
This value is too low. Even the youngest age group (10-12) would likely have an average height significantly higher than 83.25cm. The weighted average would be a combination of all three age groups and wouldn’t be this low |
Wrong 83.25cm |
14 |
Choice-D |
This value is simply too low to be a realistic average height for any age group listed in the table (typically students in these ranges would be much taller than 60cm). It’s likely a result of a miscalculation or a misunderstanding of the scale used for height (e.g., centimeters vs meters) |
Wrong 60.00cm |
15 |
Answer |
Option |
A |
16 |
Sumup |
Please summarize choices |
|
Copyright © 2020-2024 saibook.us Contact: info@saibook.org Version: 4.0 Built: 31-Mar-2025 12:00PM EST