Lesson Topics Discussion Quiz: Class Homework |
Quiz At Home |
Title: One Variable Data |
Grade Lesson s6-l1 |
Explanation: Hello Students, time to practice and review. Let us take next 10-15 minutes to solve the ten problems using the Quiz Sheet. Then submit the quiz to get the score. This is a good exercise to check your understanding of the concepts. |
Quiz: at Home
| Id | Name | Note |
|---|---|---|
1 |
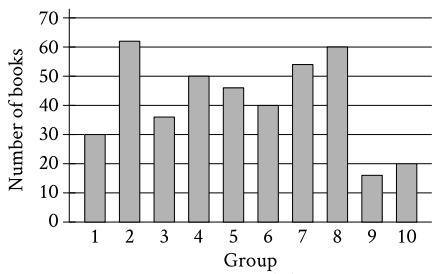
The bar graph shows the distribution of 414 books collected by 10 different groups for a book drive. How many books were collected by group 1?
|
A) 30 B) 35 C) 25 D) 40 |
2 |
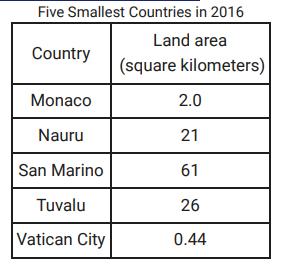
The table above shows the land area, in square kilometers, of the five smallest countries in the world in 2016. Based on the table, what is the mean land area of the 5 smallest countries in 2016, to the nearest square kilometer?
|
A) 112 B) 30.24 C) 18.19 D) 22.088 |
3 |
Data Set X contains the values: 5, 9, 9, and 13. Data Set Y contains the values: 5, 9, 9, 13, and 27. The lists provide the values in Data Sets X and Y. Which statement accurately compares the mean of Data Set X to the mean of Data Set Y? |
A) The mean of data set X is greater than the mean of data set Y B) The mean of data set X is less than the mean of data set Y C) The means of data set X and data set Y are equal D) There is not enough information to compare the means |
4 |
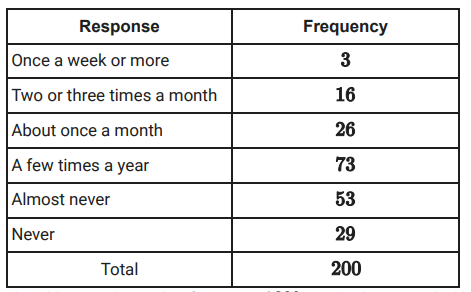
The table displays the results of a survey conducted with 200 people regarding how often they visit a movie theater. How many individuals reported seeing a movie "a few times a year"?
|
A) 43 B) 24 C) 73 D) 118 |
5 |
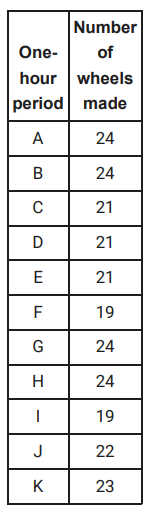
A study was conducted on the production rates of a company that produces tractor wheels. The table below shows the number of wheels made during 11 consecutive one-hour production periods. What is the range of wheels made for the 11 one-hour periods?
|
A) 4.5 B) 5.5 C) 4 D) 5 |
6 |
Each value in the data set below represents the height of a plant in centimeters: 6, 10, 13, 2, 15, 22, 10, 4, 4, and 4. What is the mean height of these plants? |
A) 8 B) 7 C) 9 D) 10 |
7 |
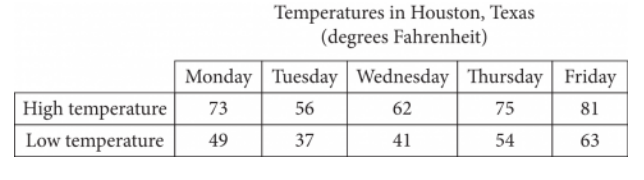
The table below displays the high and low temperatures in Houston, Texas, over a span of five days. What is the mean low temperature, in degrees Fahrenheit, for these five days?
|
A) 49 B) 50 C) 46 D) 53 |
8 |
Data Set A consists of the numbers: 72, 73, 73, 76, and 76. Data Set B includes the numbers: 61, 64, 74, 85, and X. Both Data Set A and Data Set B contain five numbers each. If the mean (average) of Data Set A is equal to the mean of Data Set B, what is the value of X? |
A) 88 B) 86 C) 90 D) 92 |
9 |
The data values are 2, 2, 2, 3, 4, 4, and 11. What is the median of these seven numbers? |
A) 9 B) 4 C) 3 D) 2 |
10 |
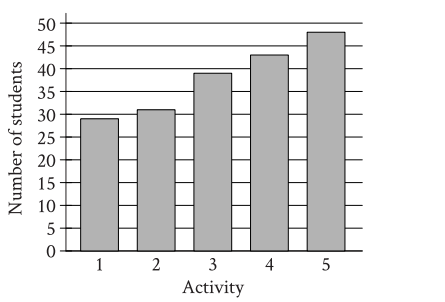
A group of students voted on five after-school activities. The bar graph displays the number of students who voted for each of the activities. How many students chose activity 3?
|
A) 39 B) 50 C) 48 D) 25 |
Copyright © 2020-2024 saibook.us Contact: info@saibook.org Version: 4.0 Built: 27-Mar-2025 12:00PM EST