Lesson Topics Discussion Quiz: Class Homework |
Definition1 |
Title: Statistics |
Grade Lesson s6-p1 |
Explanation: The best way to understand PSAT-4 is by looking at some definitions. Take turns and read each definition for easy understanding. |
Definition
Topics → Definition Example1 Example2
Definition: One Variable Data |
|
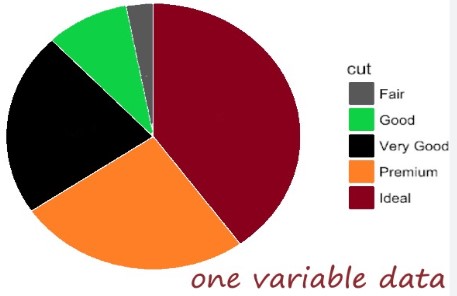
One-variable data, also called univariate data, refers to a set of observations describing a single characteristic or attribute. It focuses on measuring or recording one piece of information for each element in the dataset. |
. |
Explanation: |
|
The given image shows that one variable data contains a measuring set of observations. |
|
Definition: Two-Variable Data |
|
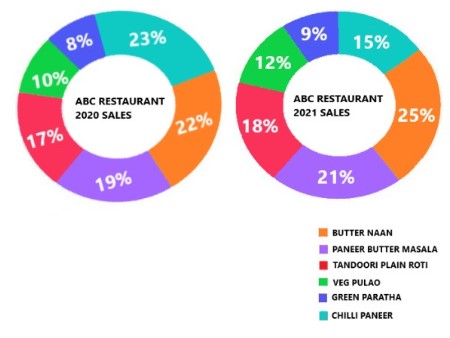
Two-variable data refers to information that involves two sets of values that can be analyzed together. It’s commonly used in statistics and mathematics to understand the relationship between two things. |
. |
Explanation: |
|
The given image shows restaurant sales in a two-variable data model. |
|
Definition: Probability |
|
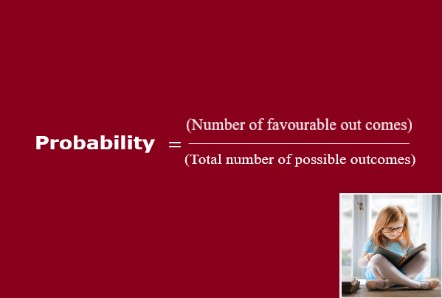
Probability is a number between 0 and 1, where 0 indicates impossibility and 1 indicates certainty. In a more formal sense, probability can be defined as the ratio of the number of favorable outcomes to the total number of possible outcomes in a given situation. |
. |
Explanation: |
|
The given image shows the probability formula, which represents the number of times a desired outcome occurs divided by the total number of possible outcomes. |
|
Definition: Evaluating Sample Statistics |
|
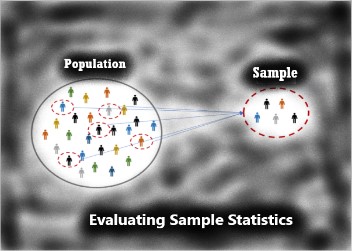
A sample statistic is any quantity computed from values in a sample and used for statistical purposes. These purposes include estimating a population parameter, describing a sample, or evaluating a hypothesis. A common example of a statistic is the average of sample values. |
. |
Explanation: |
|
The given image illustrates the concept of a population and a sample of the population. |
|
Copyright © 2020-2024 saibook.us Contact: info@saibook.org Version: 4.0 Built: 12-June-2025 12:00PM EST